


Ray & Pi

Miraculous : Ladybug et Chat Noir
Sonic The Hedgehog: 2


🚀 8 Years Professional Experience
Solutions Architecture
@ Next Pixel Entertainment
Hybrid cloud solutions leveraging IaC, containerization, golden image creation, observability, microservices, and server-less technologies.
✍️ Articles
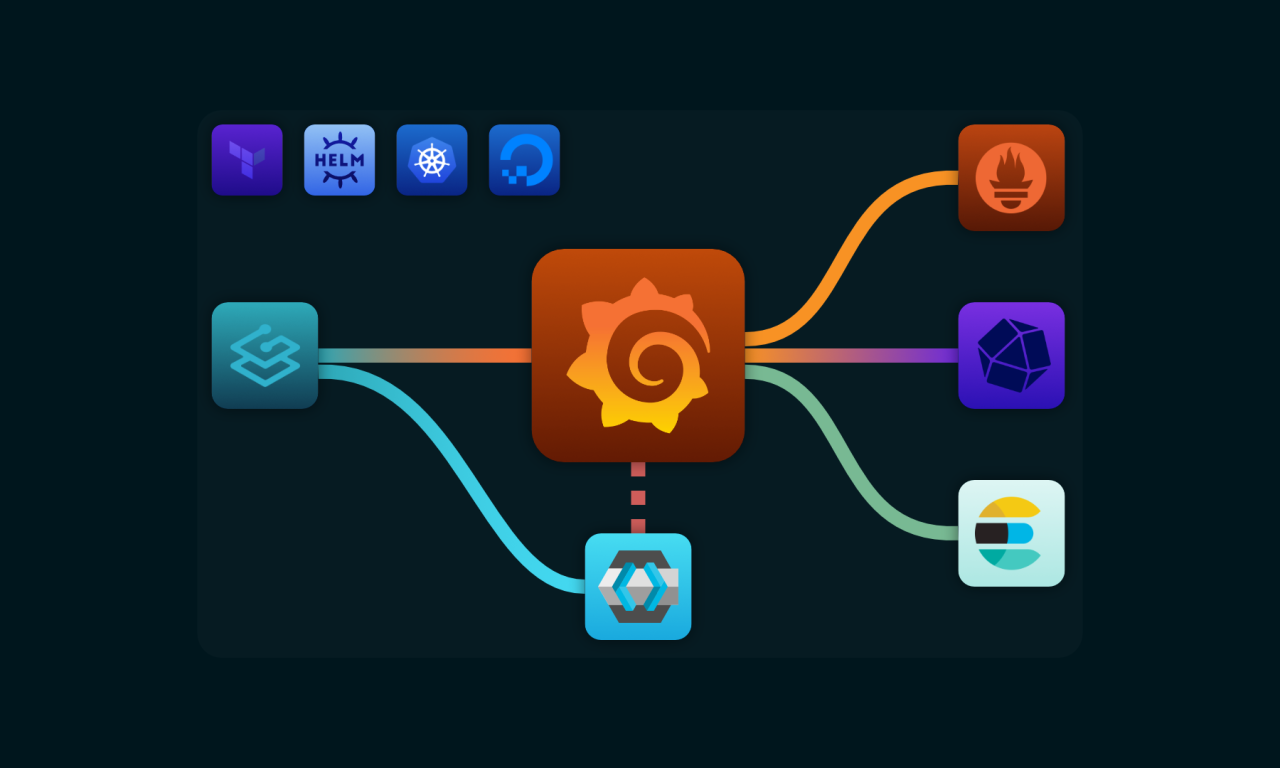
Provisioning Grafana on DigitalOcean Kubernetes Service
I deployed Grafana with multiple data sources to DOKS using Helm & Terraform.
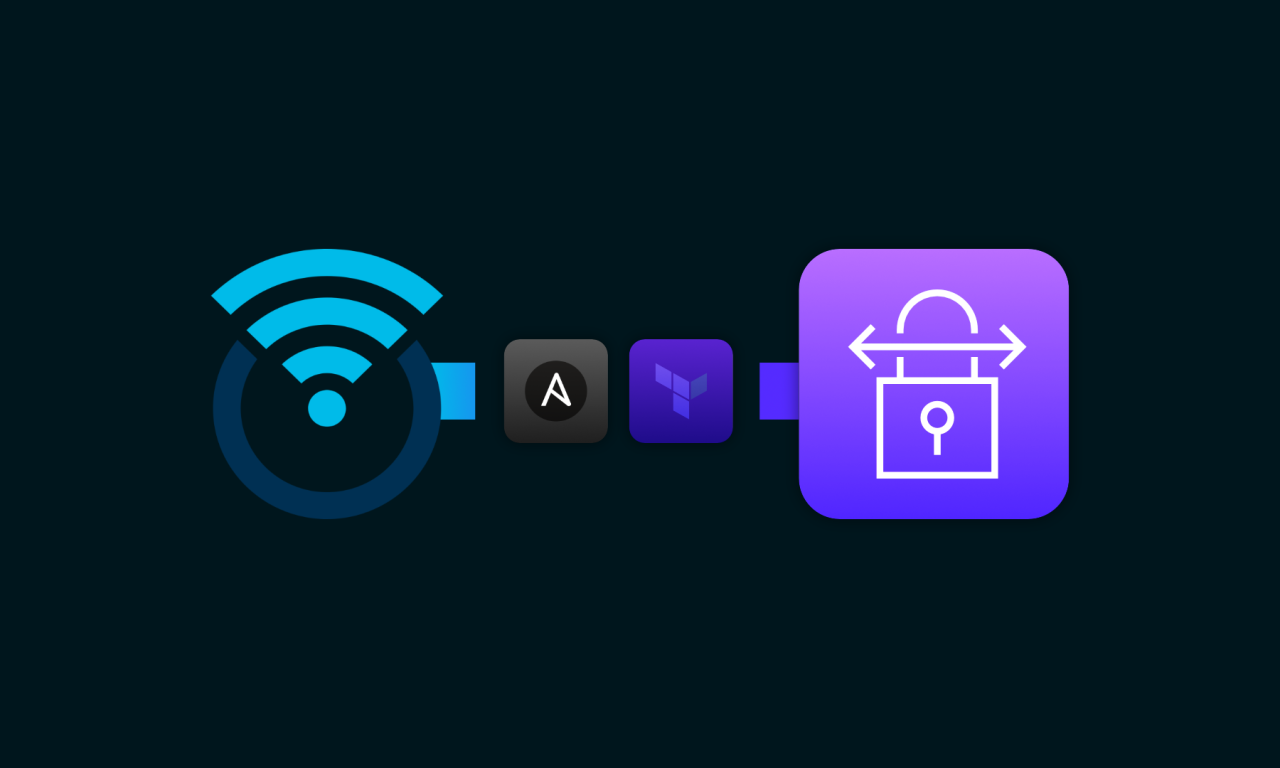
Deploying AWS Site-to-Site on OpenWRT
I connected OpenWRT to AWS using IPSec, BGP, Ansible and Terraform.
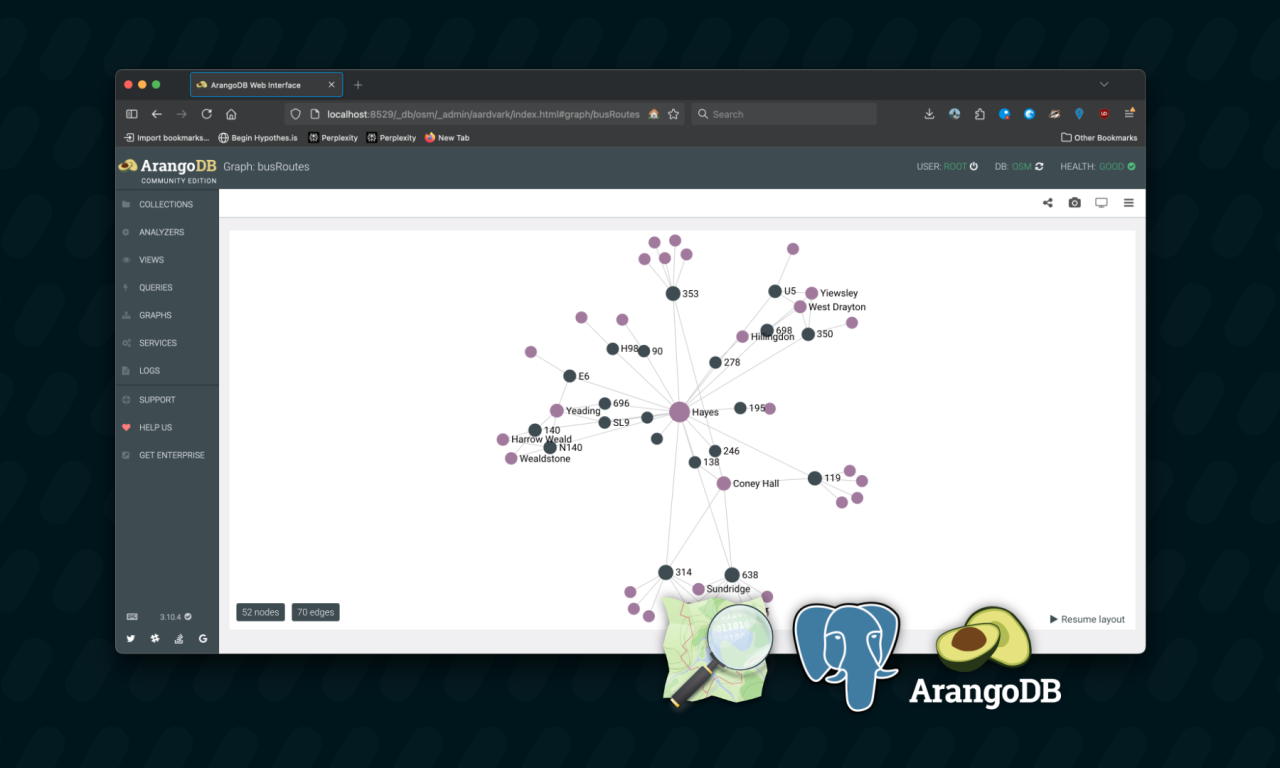
Bus route-finding with PostGIS and ArangoDB
I created a bus route finding tool using PostGIS and ArangoDB
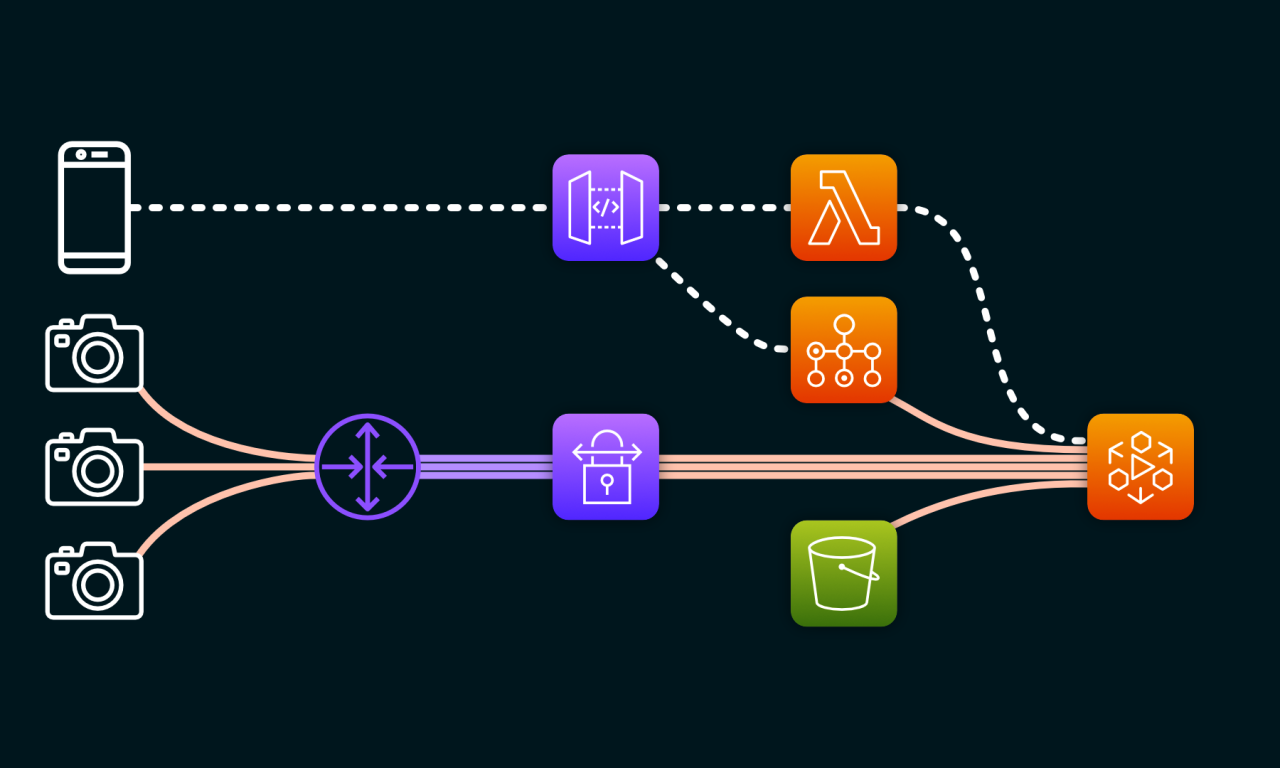
Streaming a bike riders’ journey with AWS MediaLive
I plan to create a live streaming setup for bike journeys using GoPro and AWS.
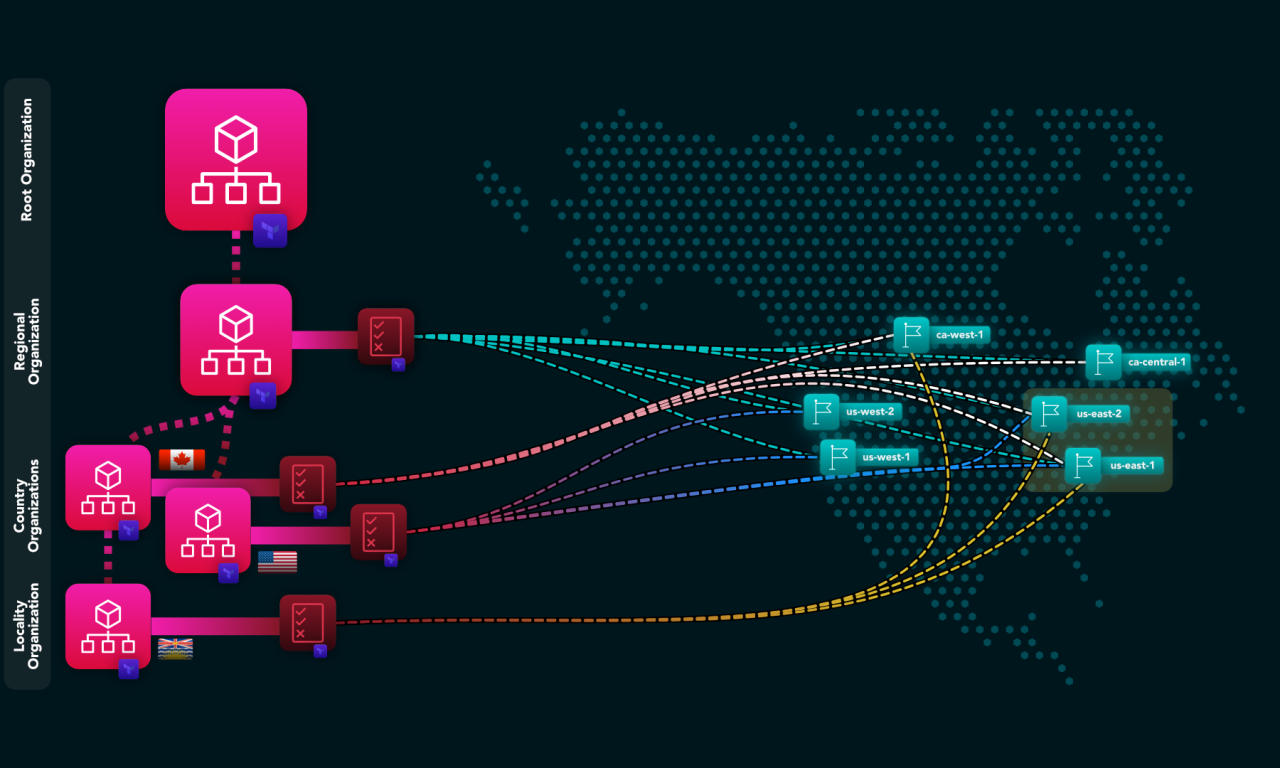
Deploying Region-locked AWS Organizations using Terraform
As a solutions architect, I was tasked with building an AWS Organizations hierarchy for a Canadian startup that needed to…
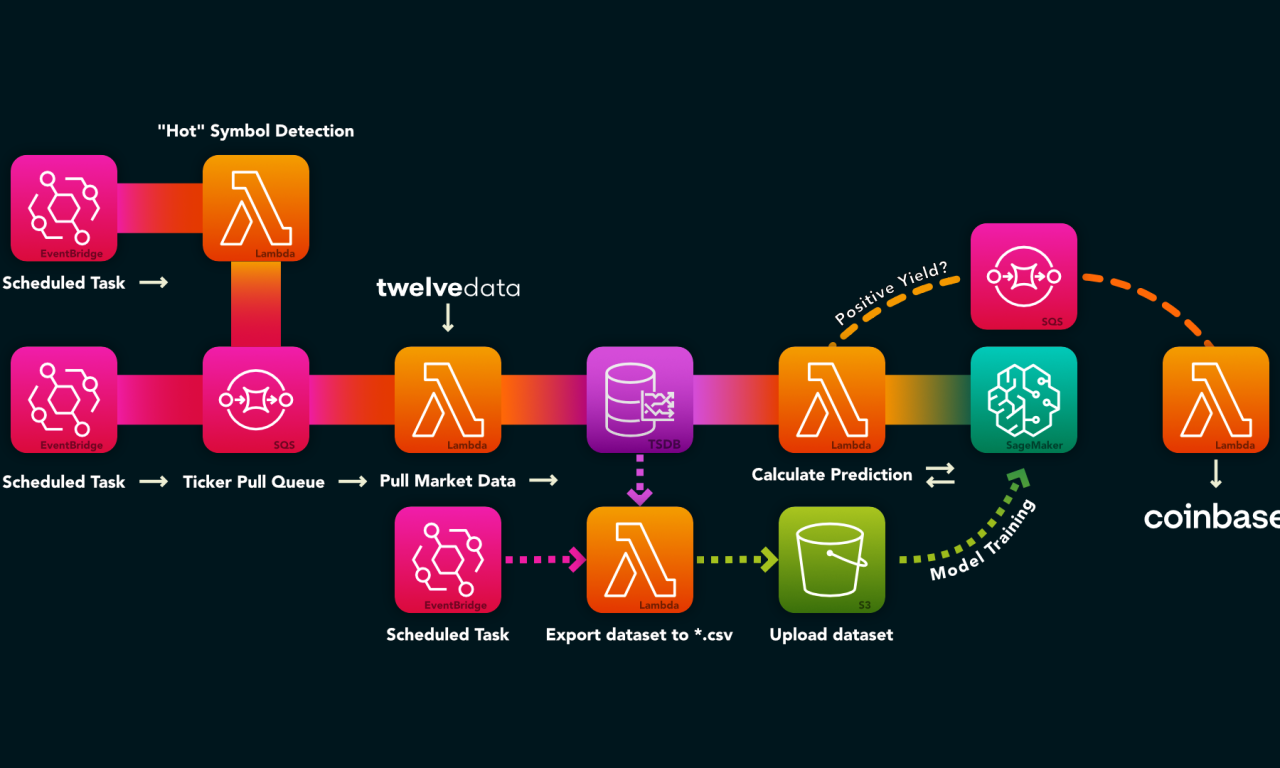
Idea: Adopting Serverless for Trading Operations
I’m not very into day-trading, but I see the potential in the market from time to time, so I came…
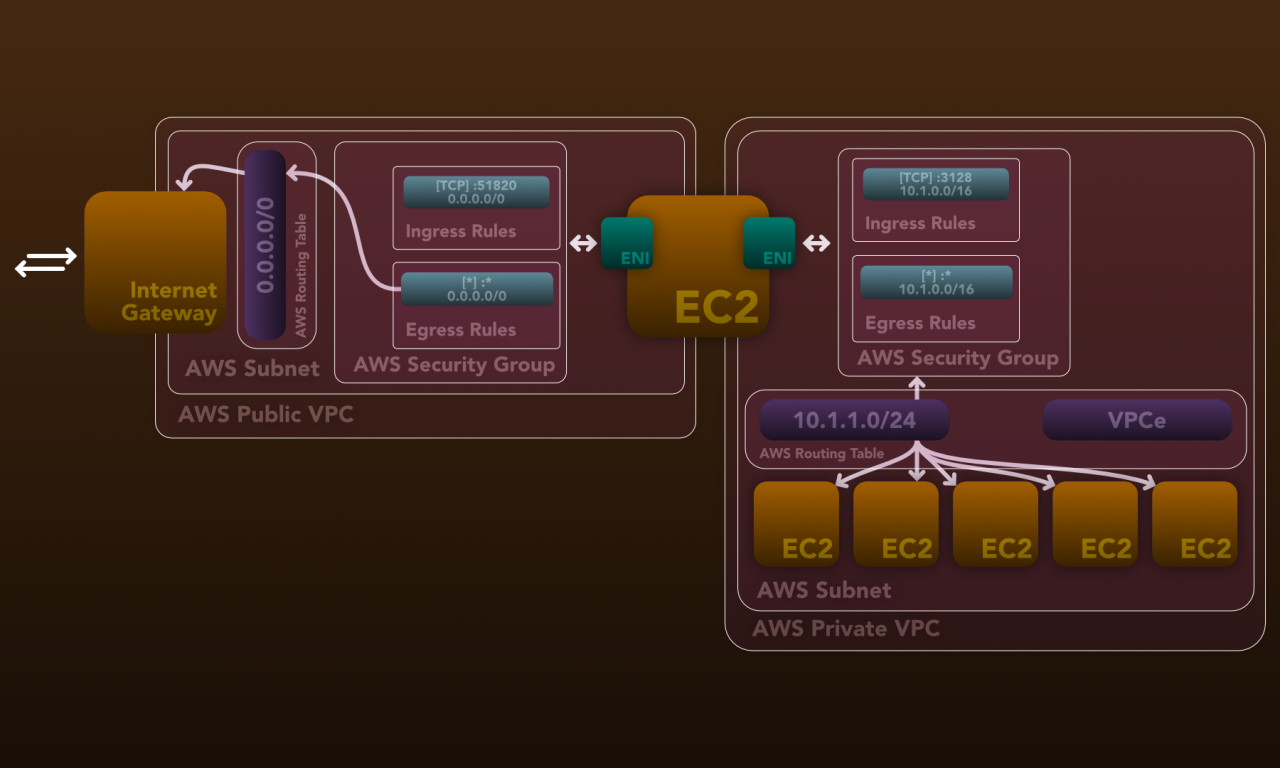
Outline: Extending a home network setup in AWS
As someone without a permanent base, I needed a secure and flexible cloud infrastructure that allowed me to spawn powerful…
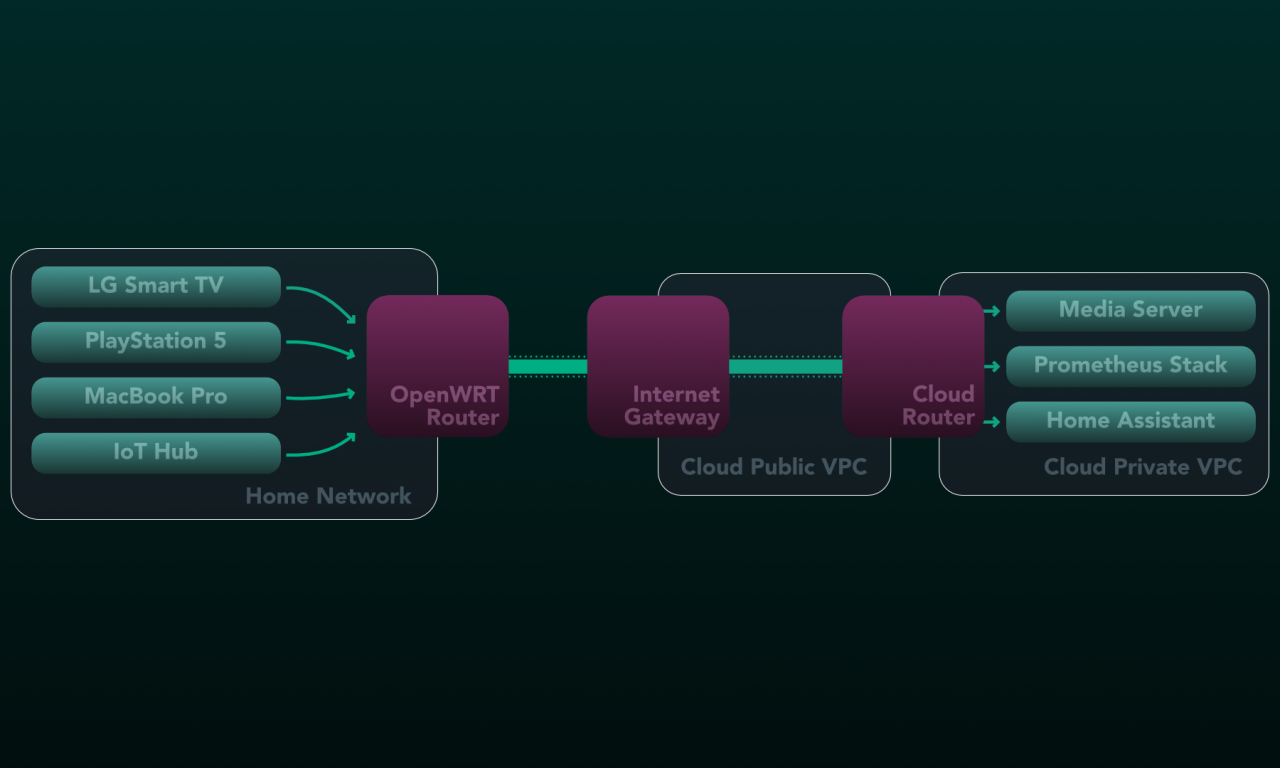
Overview: Extending my home network to the cloud
I deployed the services I run at home to the cloud due to constant relocation.
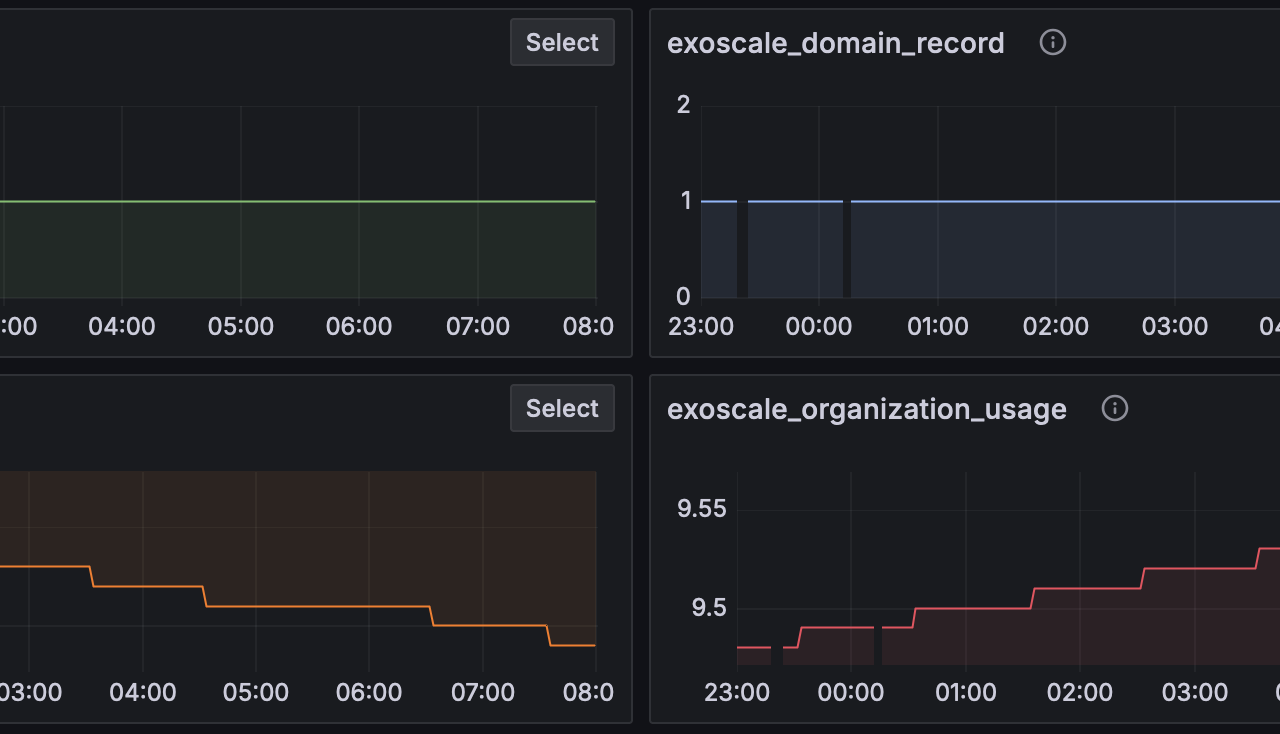
Exoscale Exporter for Prometheus
I’d built a Prometheus exporter for Exoscale, allowing me to visualize cloud spending and resource usage from a central location alongside AWS and DigitalOcean.